Excel for Everyday Tasks: A Practical Beginner's Tutorial
Excel is not just for accountants! With this step-by-step tutorial you will handle everything from shopping lists to family budgets and work reports like a pro.
Microsoft Excel is the most widely used spreadsheet software in the world, yet many users are familiar with only a small fraction of its capabilities. The truth is that using Excel effectively requires no accounting knowledge or advanced mathematics; with a few basic concepts and six or seven simple functions, you can finish in minutes tasks that used to eat hours of your time. In this tutorial, we start the learning path by getting to know the software's environment and end up with tricks that come in directly handy in everyday work — from managing the household budget to office reports.
Get to know the Excel environment in three minutes
When you open Excel, you are faced with a screen built from small rectangular boxes. Each of these boxes is called a “cell” and sits at the intersection of columns (labeled with letters starting from A) and rows (numbered starting from 1). Every cell has an address; for example, cell B5 means the intersection of column B and row 5. A set of these cells on one page is called a “sheet” or worksheet, and the collection of sheets makes up a “workbook” file. Data in Excel comes in three main types: text, numbers, and dates. Recognizing the data type matters, because numbers, for instance, can be summed but text cannot; if a number ends up on the left side of a cell, Excel has assumed it is text and you need to fix the cell's format.
Formulas: Excel's real magic
Anything in Excel that starts with an equals sign (=) is a formula, and Excel calculates it. The simplest job is arithmetic: type =A1+B1 and see the sum of the two cells. The real power appears when you use cell addresses instead of raw numbers, because whenever the content of a cell changes, the result updates automatically. The four basic operations are done with the signs +, -, *, and /, and for the order of calculation you use parentheses, exactly like school math.
- SUM for adding up a range: =SUM(A1:A10) totals all the numbers in column A from row 1 to 10
- AVERAGE for the mean: =AVERAGE(B2:B30) calculates the average of the numbers
- MAX and MIN for the largest and smallest value in a range
- COUNT for counting numeric cells and COUNTA for counting filled cells of any kind
The functions that do the most work for you
After the basic functions, there are three that take your work to a fully professional level. The IF function makes automatic decision-making possible; for example, =IF(B5>=10000;"high";"low") tells Excel that if the value of cell B5 is equal to or greater than ten thousand, it should write the word “high”, and otherwise “low”. The SUMIF function is conditional summing; for example, adding up only the expenses of one particular month or one particular category. And COUNTIF is conditional counting; for instance, counting how many invoices you have above a certain amount. The combination of these three functions covers most office and personal reporting needs. For looking up information from another table, the VLOOKUP function — or its newer version XLOOKUP — comes into play, and we will teach it fully in upcoming articles.
Conditional formatting: putting color to work on your data
One of Excel's most attractive features is conditional formatting (Conditional Formatting), which automatically gives cells color and styling based on their values. For example, you can decide that expenses above a certain limit are displayed with a red background, or that the top values in a sales table are marked with a green color scale. To do this, select the range in question, click Conditional Formatting on the Home tab, and choose one of the ready-made rules. This simple tool turns a dry list of numbers into a visual, understandable report in a few seconds — something managers and clients love.
Charts: see your data instead of reading it
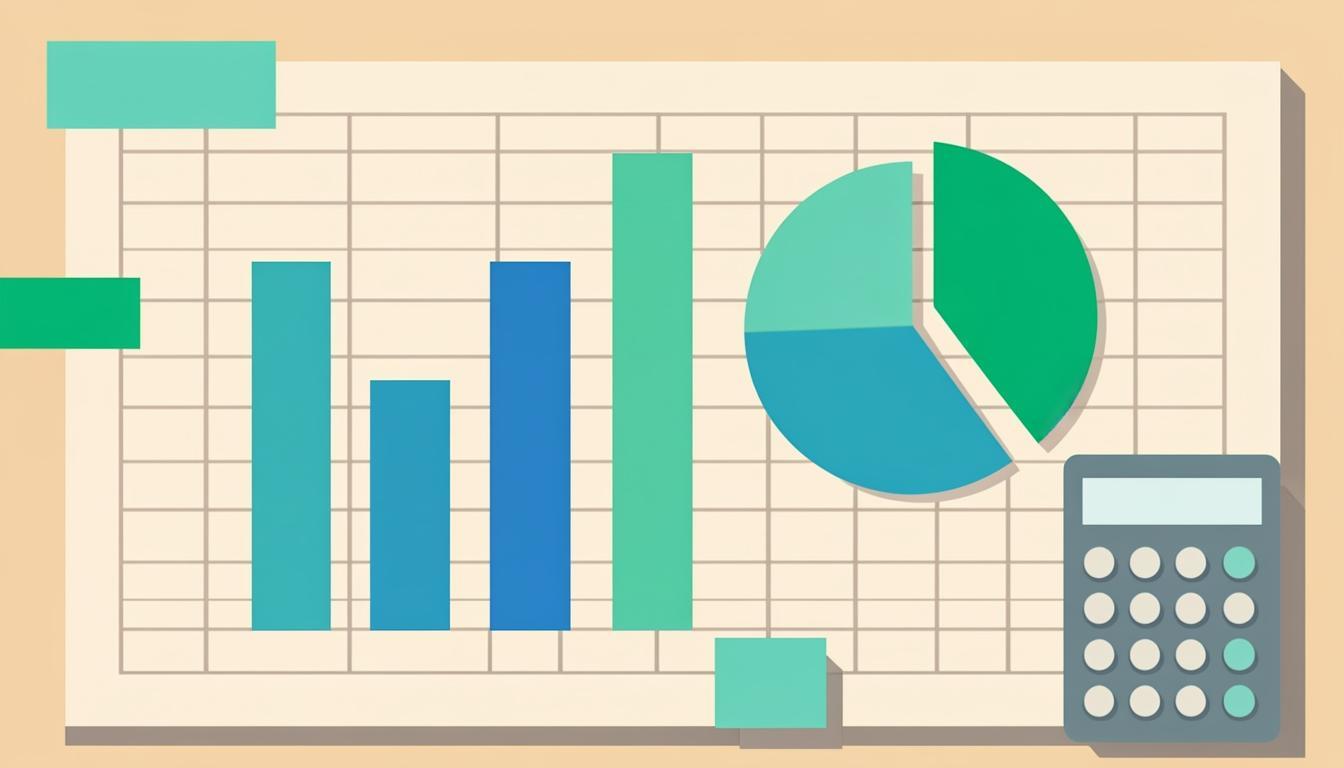
Staring at large tables to find trends is tiring and error-prone work. A chart does the job at a single glance. To build a chart in Excel, select the data range and click one of the chart types on the Insert tab. Get to know the three main types: the column chart for comparing values across different groups (say, monthly sales), the line chart for showing trends over time (say, price changes), and the pie chart for showing each part's share of the whole (say, what percentage of the budget each expense takes). After you create the chart, one click on it makes the styling buttons appear beside it, and you can change the colors, titles, and labels however you like.
Keyboard shortcuts that save you hours every day
- Ctrl+C, Ctrl+V, and Ctrl+X: copy, paste, and move — just like everywhere in Windows
- Ctrl+Z: undo the last change; made a mistake? Do not panic, just revert it
- Ctrl+Arrow keys: jump to the end of the data in the direction of the arrow; superb for navigating large tables
- Ctrl+Shift+L: turn filters on the header row on or off; the fastest way to find specific records
- Ctrl+; (semicolon): insert today's date into the active cell
- Alt+Enter: go to a new line inside the same cell; perfect for multi-line addresses and notes
- F4 (after clicking a cell address inside a formula): lock the cell address with dollar signs for safe formula copying
- Ctrl+T: convert a data range into a formal table with automatic filtering and sorting
Common mistakes best avoided from day one
Most of the problems in beginners' Excel files are rooted in a few wrong habits. Mistake one: recording data in several separate files instead of different sheets of one file; this makes comparison and summarizing impossible. Mistake two: combining information in one column, such as writing the first and last name, or the city and postal code, in a single cell; always keep information in separate columns so it stays analyzable later. Mistake three: empty rows in the middle of the data, which break filtering and charts. And mistake four: typing results by hand instead of writing formulas; the day the data changes, all those manual numbers turn wrong and you will never know.
Wrapping up and a suggested exercise
You do not learn Excel by reading; you learn it by building. We suggest one real exercise: create a file today with four columns (date, expense description, category, amount) and record one month of your expenses. At the end of the month, use SUM to see your total expenses, SUMIF to separate the cost of each category, conditional formatting to turn the heavy expenses red, and finally build a pie chart of the categories' shares. It is a small but complete project that repeats in practice everything taught in this article. Later in this tutorial series we will move on to lookup functions, the Pivot Table, and automating tasks, so stay with TakRah.